Color Names Explorer
By: Jeff Clark Date: Thu, 27 Mar 2008
Dolores Labs recently did an interesting experiment where they showed many people samples of colors and asked them what they should be called. They posted a graphic that showed the color names that people used for the various colors.
Dolores Labs' Color Name Cloud (click to see larger version in original article)
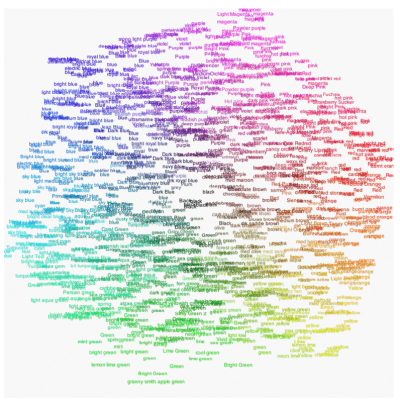
They also posted the raw data for other people to play with. Martin Wattenberg at IBM Research took the data and created a much more beautiful graphic. Nathan at FlowingData discusses the design differences in the post A Little Bit of Design Goes a Long Way With Infographics.
Wattenberg's Version of the Color Name Cloud (click to see larger version in original article)
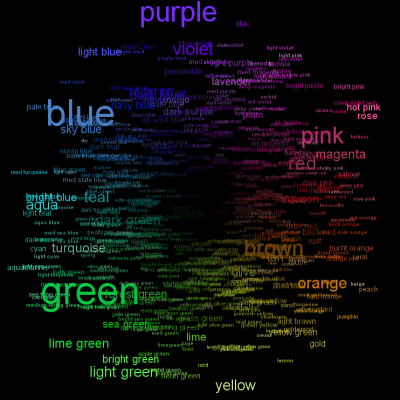
I decided to try my hand at building a simple interactive 3D explorer for the data as well. I combined entries with the same name and found the average RGB values. The frequency count was used to highlight the more common names by scaling the size of the text in a manner likely similar to that used by Wattenberg. I then plotted the names in 3D using the red (x), green (y), and blue (z) components of the color value.
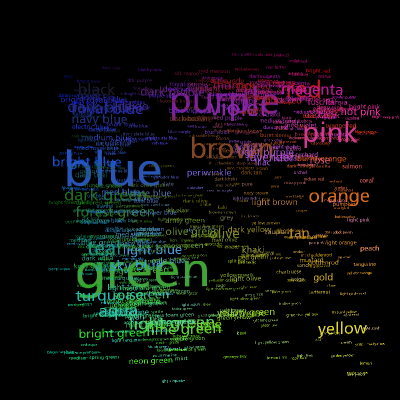
Color Name Cloud - initial view
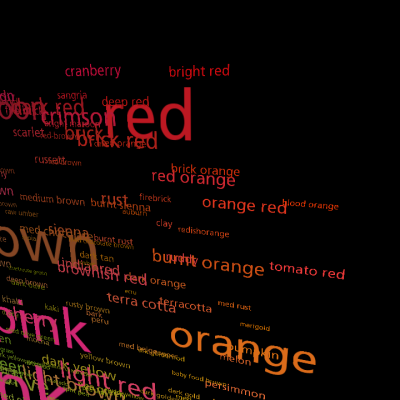
Color Name Cloud - zoomed in view
The initial view is similar to Wattenberg's but not spaced out as nicely. My version also suffers from the fact that the size of the name depends on both frequency of use and how much blue the color happens to contain since the more blue a color has the closer it is drawn to the front of the display.
You can try out the color name explorer below. Can you find the shade somebody called 'baby poop' ?
The application may take 10-20 seconds to start up. While you are waiting here are a few instructions:
- Move the mouse cursor above or below the middle to move the scene up or down.
- Move the cursor left or right to pan.
- Holding down the left mouse button will zoom in and holding down the right mouse button zooms out. You can also use the 'f' key to zoom in and the 'r' key to zoom out.
- The 'p' key will toggle whether the display is paused.
- The space bar resets the view to where it started.
The application was built with the wonderful Processing - many thanks !