Snowmageddon Twitter Analysis
By: Jeff Clark Date: Fri, 30 Jan 2009
Around the middle of December 2008 many parts of Canada and the US had fairly severe snowstorms. The name 'Snowmageddon' became popular for describing the event. I've collected data from Twitter on how this term, and the spelling variation 'snowmaggedon', was used. I've built a new interactive visualization to support exploring these messages along the dimensions of time, geography, and the actual message content. This is based on the work I did recently showing the tweets related to Obama's inauguration. For the impatient you can try out the application here: Snowmaggedon on Twitter.
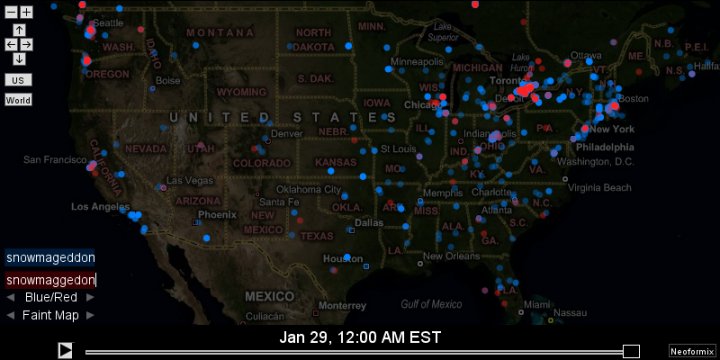
Here are some maps showing the results. This first one shows a few things:
- The term was used widely across both Canada and the US with high concentrations in Seattle, Chicago, Toronto, and the US North-East
- Both spelling variations were used widely as well
- Surprisingly high references in warm places like Los Angeles and Florida
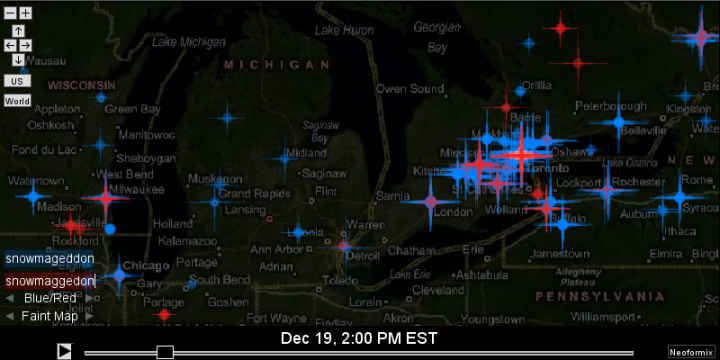
This second image shows the great lakes region around what appears to be the peak which occurred around 2pm on Dec 19th. Starbursts are used to highlight references around the current time and the time slider has been adjusted here to show the maximum number of starbursts.
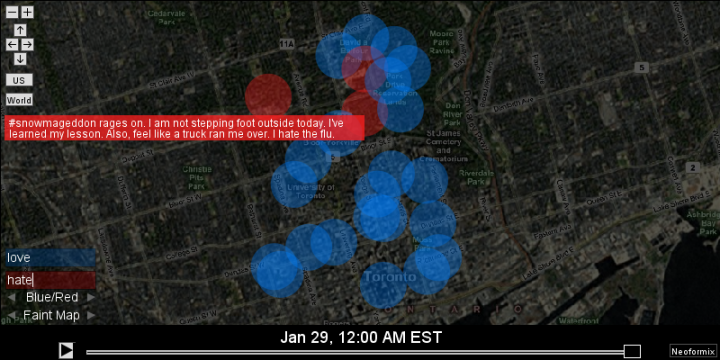
A close-up of Toronto with the filters set to 'love' and 'hate' shows that the extreme weather caused extreme emotions in some people. Note that a little bit of noise was added to the latitude and longitude coordinates so that at high magnifications there is some separation between messages that were sent from the location 'Toronto'.
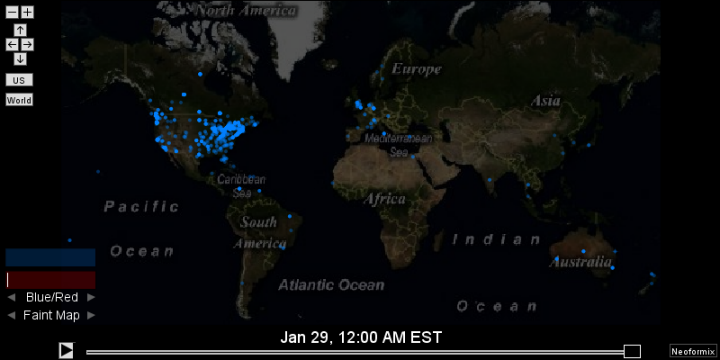
A map showing the entire world shows that use of the term was not limited to Canada and the US.
Of course the real fun comes from playing with the interactive version so make sure you give Snowmaggedon on Twitter a try !