NHL Points Over Career
By: Jeff Clark Date: Mon, 19 Apr 2010
One charting technique that I really like is to take time series for related data that occured over different time periods and align them to a common starting point so they can more easily be compared. One good example is this graph comparing this recession to the last five in terms of employment decline. Another one, this time interactive, is from the NYT and depicts Paths to the Top of the Home Run Charts.
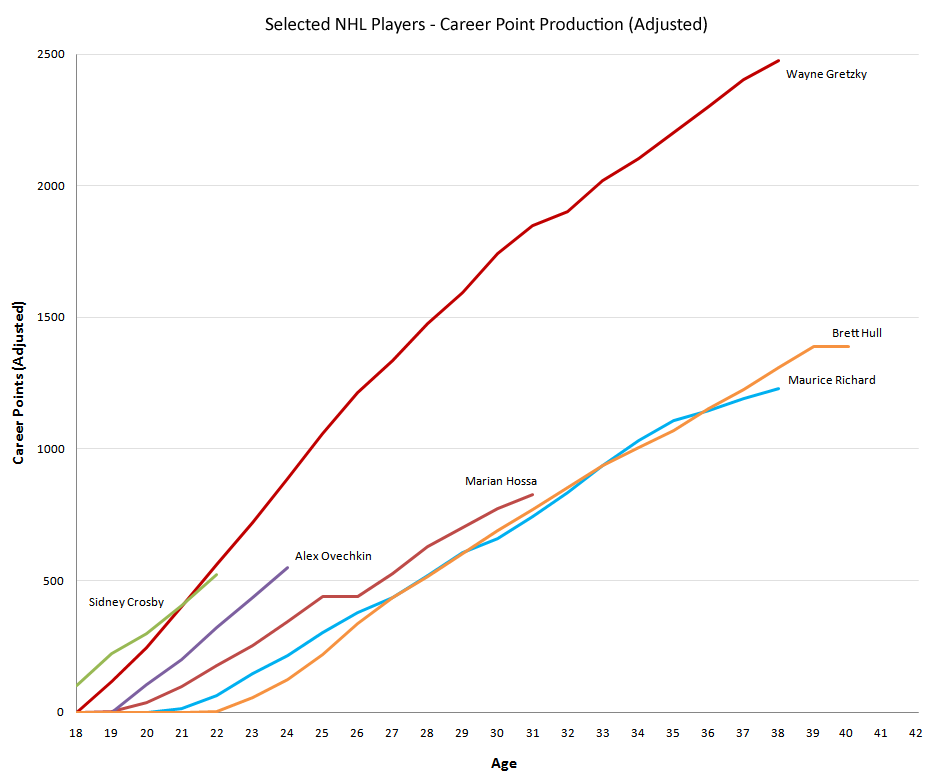
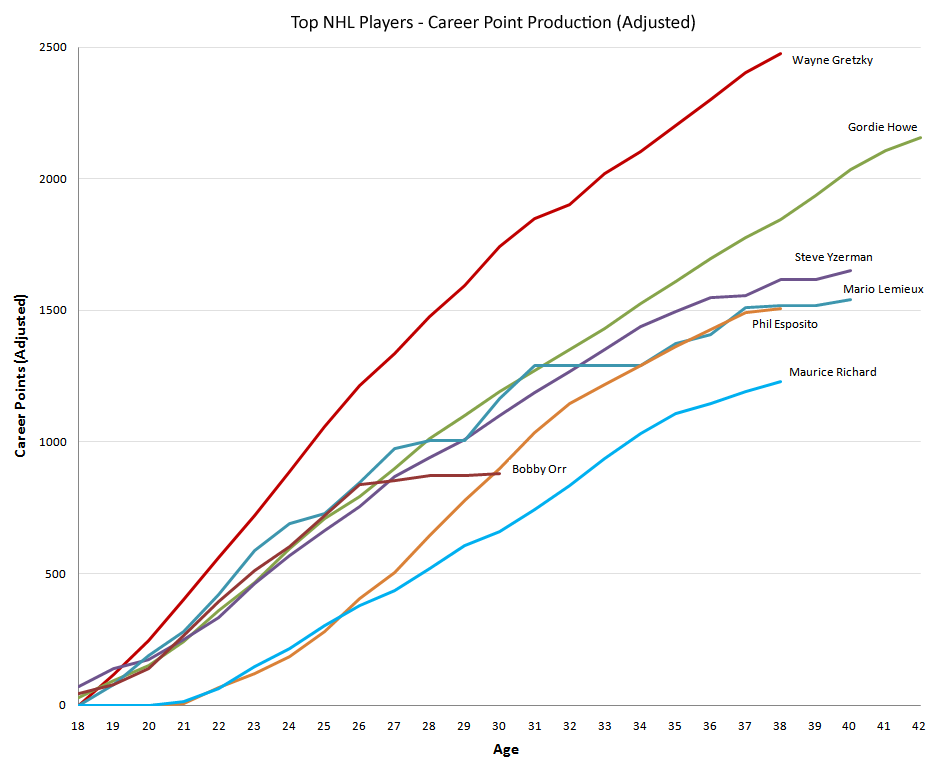
I have created a couple of simple line charts showing cumulative point production (goals + assists) for selected NHL players over their careers. I'm actually using Adjusted Points which try to control for the fact that teams played fewer games in the past and rule changes and other factors impact the ease of scoring goals over time. Data is from Hockey-Reference.com.
This first chart shows many of the top players from the past. I only showed data up until age 43. Gordie Howe did get points in the NHL at age 51 but they were negligible in the overall results other than to illustrate his amazing longevity as a player. The graph clearly shows why Wayne Gretzky is called the 'Great One'. You can also see the various plateaus due to injury for Lemieux, and early career end for Bobby Orr (who is also the only defenceman shown here).
The second graph keeps Gretzky and Richard for comparison but highlights many of today's top stars. Crosby appears to have a legitimate chance to match Gretzky but has a long way to go...