Love and Hate on Twitter
By: Jeff Clark Date: Mon, 14 Feb 2011
I have been collecting tweets containing the words 'love' and 'hate' for a couple of years now and decided to analyze them to see what could be discovered. It was a fun project that I finished just in time for Valentine's Day. I hope you love it!
For the data I chose to use every tenth tweet containing the word 'love' and every tenth tweet containing the word 'hate' from all of 2010. This yielded 658,391 love tweets and 503,489 hate tweets. Incidentally, this means there were roughly 6.5 million tweets last year containing 'love' and about 5 million containing 'hate'.
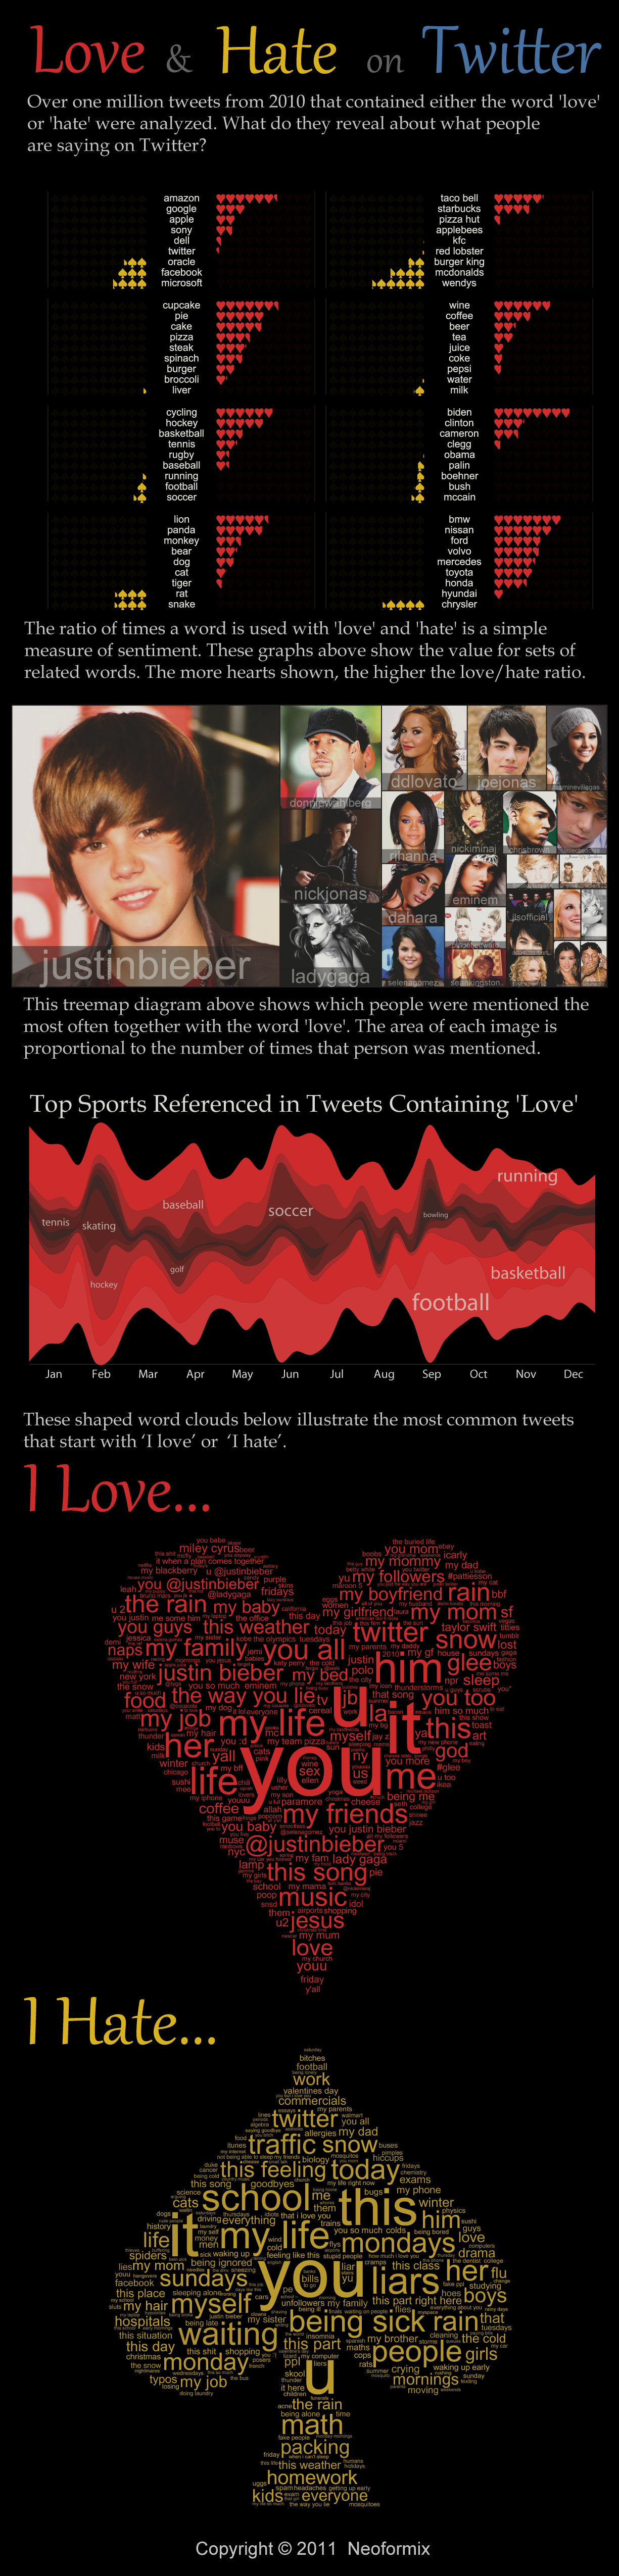
The first set of diagrams in the graphic show the love/hate ratio for various sets of related words. Basically, I counted the number of times a word appeared together with 'love' and together with 'hate'. A simple percentage of 'love' associations out of the total gives a basic measure of sentiment - let's call it the Love Quotient ;) A value near 100% means the word is used almost exclusively with 'love' and never with 'hate' and the graph will show hearts all the way to the right side. Each full heart represents 5% over the 50% neutral point so, for example, 'amazon' has six and a bit hearts showing so its' Love Quotient is about 82%.
Using simple word association is a pretty crude measure of sentiment. It obviously would be fooled by a sarcastic tweet like: Ugg - liver and onions again. Don't you just love the food in the cafeteria? Even so, by looking at large quantities of data it seems to give reasonable results in many cases. The data definitely settles the age-old question: pie > cake!
The diagram with all the photos is actually a Treemap. Surprisingly, this is the first treemap to appear on Neoformix since my second post back in April of 2006 about The Map of the Market. This one shows the people who were mentioned most frequently with the word 'love'. It's dominated by celebrities, mostly singers who appeal to young teenagers.
The StreamGraph shows how the word 'love' was used together with various sports over the course of 2010. The term 'football' combines references to both american football and international football (soccer). You can see the peak in June for the World Cup and peaks for both hockey and skating during the winter olympics in February.
Text analysis and creation of the various graphics was done with custom code created in Processing. The Treemap diagram used the Treemap library created by Benjamin B. Bederson and Martin Wattenberg. Thanks!