Spot
By: Jeff Clark Date: Thu, 12 Jan 2012
This post was modified on February 15th, 2012 to reflect changes in the software.
Spot is an interactive real-time Twitter visualization that uses a particle metaphor to represent tweets. The tweet particles are called spots and get organized in various configurations to illustrate information about the topic of interest.
Spot has an entry field at the lower-left corner where you can type any valid Twitter search query. The latest 200 tweets will be gathered and used for the visualization. Note that Twitter search results only go back about a week so a search for a rare topic may only return a few. When you enter a query the URL is changed so you can easily bookmark it or send it to someone. The query brainpicker gives you a display something like this:
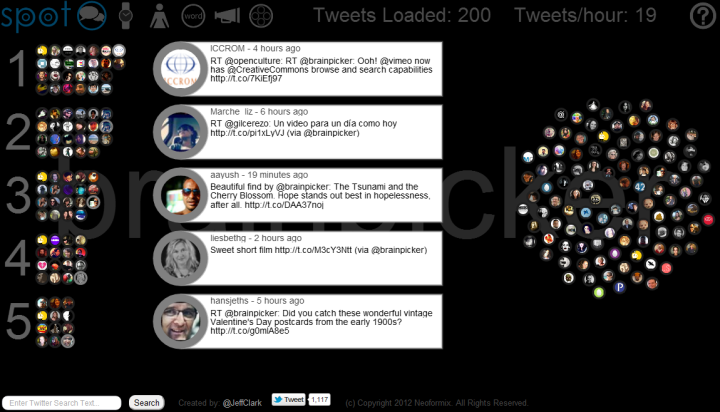
At the top left, next to the logo, are six icons to access the different views. The first is called Banner mode and is shown above. Basically, tweets that share a lot of the same words are grouped together and the top five groups are shown. Tweets are often grouped because they are retweets of the same original content but this doesn't have to be the case. They may be tweets from different people that don't even know each other but happen to be discussing the same thing. The intent is to show quickly the most popular things people are saying about a particular topic. Tweets that are more unique are placed in the phyllotaxy spiral to the right.
All the tweet spots show an image of the sender and at any time can be clicked on to see the tweet details. Clicking on the text of an open tweet will show the original in another browser window. Click on the background or an open tweet spot to close it or you can directly click on another spot.
The Different Views
Here is a complete list of the views and what they show:
- Banner View (speech icon) shows the top five groups of similar tweets
- Timeline View (watch icon) places tweets along a timeline based on when they were sent
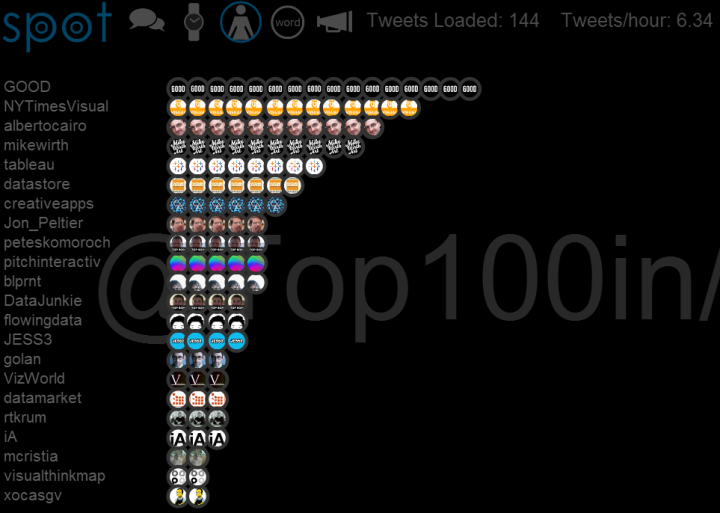
- User View (person icon) shows a bar chart with the people sending the most tweets in the set
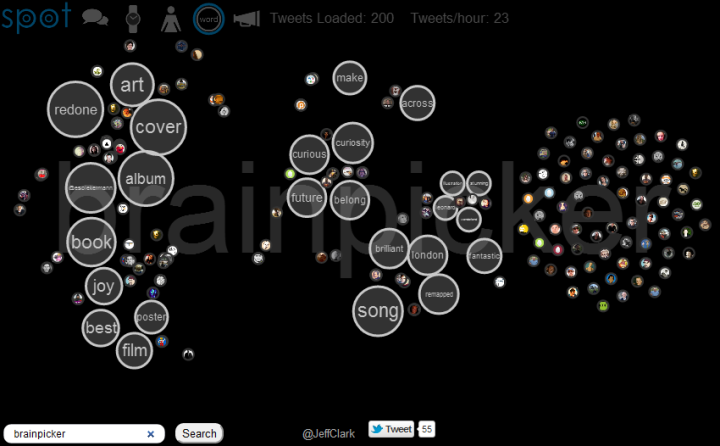
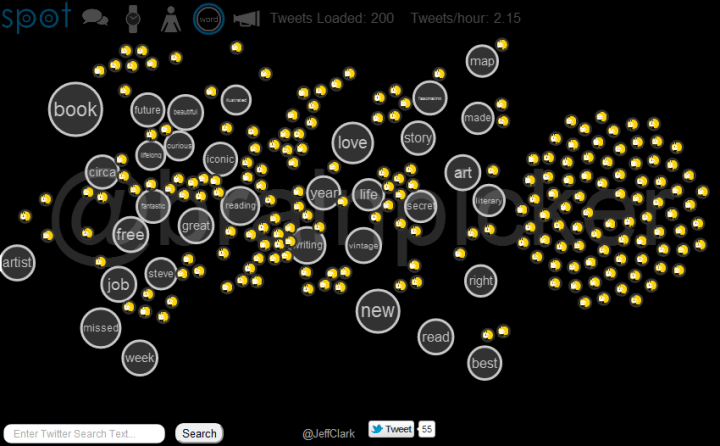
- Word View (Word Circle icon) directly shows word bubbles with tweets attracted to the words they contain
- Source View (Megaphone icon) a bar chart showing the tool used to send the tweets (or sometimes the news source)
- Group View (circles in circle icon) places tweets that share common words inside large circles
The Word View, again for the query brainpicker:
User and Twitter List Queries
The string 'brainpicker' matches the wonderful twitter account by Maria Popova and the results shown above are mainly retweets of or discussions about the tweets she has sent. You can also do a search for @brainpicker including the @ sign to see the latest tweets sent from that account. This uses the standard Twitter API to get the data and so can go back farther in time. The Word View for this query clearly shows the Brainpicker focus on books, reading, writing, art, and maps.
You can also retrieve the latest tweets from a twitter list. Here is an example for a list I created by analyzing who was on various lists created about data visualization. In the search field enter @Top100in/datavis and you should get something like this for the User View:
Technology and Credits
I was inspired to create this when playing with the wonderful Twitter visualization called Revisit by Moritz Stefaner. Another influence was the Stamen work on Digg swarm which is no longer active but there is a video. My academic background in physics makes it natural for me to think in terms of interacting particles.
This application was created with the wonderful Processing.js which is the javascript-based extension of the Processing tool I have used in the past. Thanks to Ben Fry, Casey Reas, John Resig, David Humphrey and the other people in the Centre for Development of Open Technology at Seneca College. Thanks also to Jim Bumgardner for the excellent tutorial on phyllotaxy spirals and to The Noun Project for five of the icons. Thanks also of course to Twitter and all the people who fill it with great content!
Performance is pretty good with the Chrome browser, and decent in Firefox and Safari. It will not work in Internet Explorer (except perhaps the new IE 9). It seems to work reasonably well on the newer iPads although the search field is broken currently in that environment. The application will go out and get new tweets periodically. For popular queries the analysis and display of those tweets will often cause lagging to occur.