Radial Treemap for US Auto Sales
By: Jeff Clark Date: Thu, 27 Jul 2006
Here is another example of a Radial Treemap (or Multi-Level Pie Chart). See the previous post for an introduction to the idea.
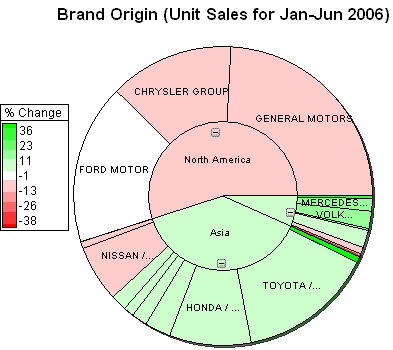
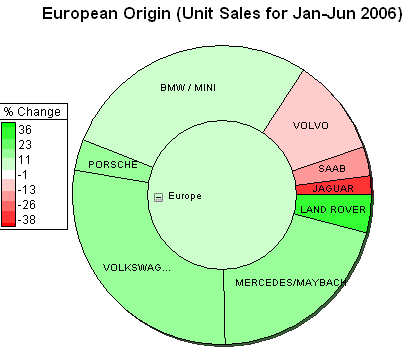
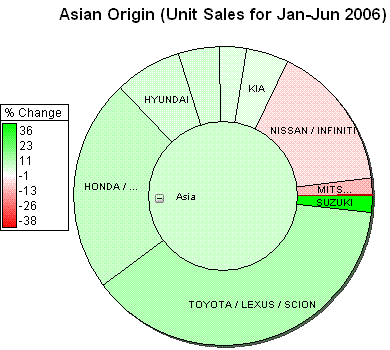
This chart shows US auto sales for Jan-Jun 2006 using data from Morgan and Company. I've shown detail graphs for both Asian and European brands as well.

Some quick take aways:
- European and Asian brands are approaching 50% of sales
- North American brands are showing negative growth compared to last year
- European and Asian brands are showing positive growth overall compared to last year
- Toyota sales are about the same as Chrysler's and are approaching Fords.

- Volvo, Saab, and especially Jaguar have negative growth
- Land Rover showing exceptionally strong growth (+28%)

- Nissan and Mitsubishi have negative growth
- Suzuki showing exceptionally strong growth (+36%)