Digg Story Graph
By: Jeff Clark Date: Fri, 07 Dec 2007
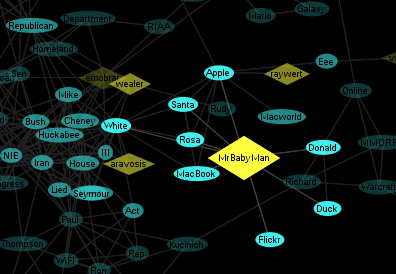
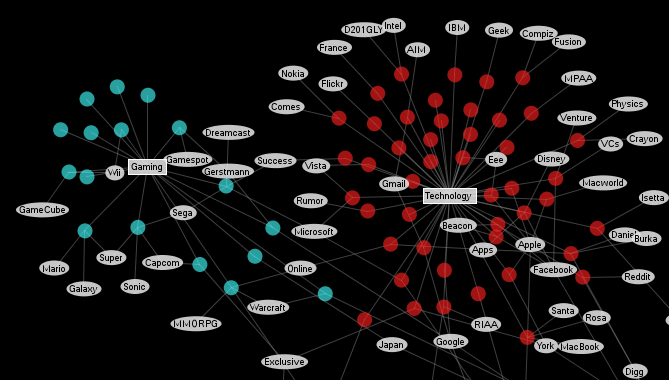
The information provided by the Digg API is quite rich and very relevant to the community of Digg users. I've created a second visualization using the API, this one focussed on the relationships between the latest popular stories. The Digg Story Graph is an interactive visualization that shows the relationships between recent popular stories on Digg through the use of node and link diagrams. Stories can be visually connected through shared vocabulary, common topics, domain, submitter, or date submitted.
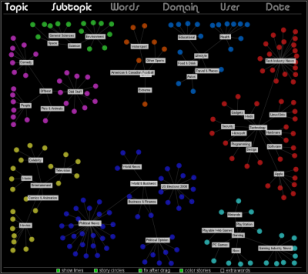
There is also a large version of the Digg Story Graph available. It requires 900x800 pixels for proper display and a decent CPU for good responsiveness. The smaller version shows the 100 latest popular Digg stories. The larger version will show 200 and support more word nodes.
Give it a try !