Election Visualization
By: Jeff Clark Date: Wed, 31 Oct 2007
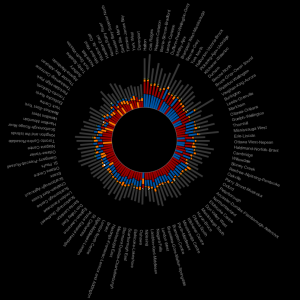
Patrick Dinnen over at Hogtown Consulting has produced an interesting visualization of election results. It's an interactive application built using Processing, my favourite toy of the moment. Currently the data used is for the Ontario 2003 election but the idea could, of course, be applied more generally.
I did have trouble running the application using IE 7 on Win XP - it shows a tiny window rather than the desired size but it works fine for me using Firefox.