Top 20 Data Visualizations Mentioned on Twitter
By: Jeff Clark Date: Mon, 18 Jan 2010
For many people Twitter has become the best place for discovering the latest and most interesting work in a variety of fields. In my twitter client I keep a search column open that gets constantly updated with the latest tweets pertaining to data visualization or infographics and I see lots of beautiful content flow by. I've been collecting these tweets for quite a while and thought it would be interesting to analyze them and see which visualizations were shared through twitter the most often.
Many of the top links in the domain were articles containing collections of visualizations chosen to be the 'Top NNN' by some panel of experts. For example, the top most shared link was 50 Great Examples of Data Visualization by Web Designer Depot. I will have another post in the near future that lists the most popular of these types of links as well as separate lists for products/frameworks and news/analysis. For this list I chose to focus instead on references to individual data visualizations or infographics.
Here are the top 20 ordered by popularity. Click on either the link or image to go to the original article.
2. Stunning data visualization in the AlloSphere - Video on TED.com

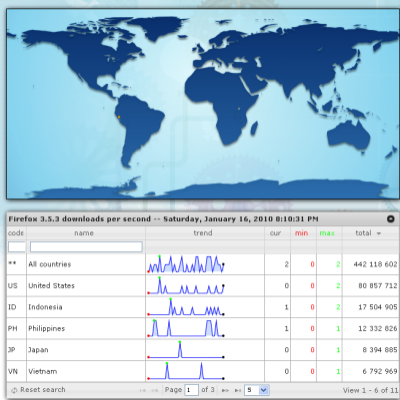
3. Worldwide Real-Time Firefox Downloads
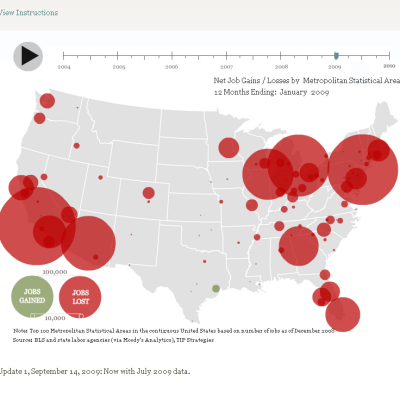
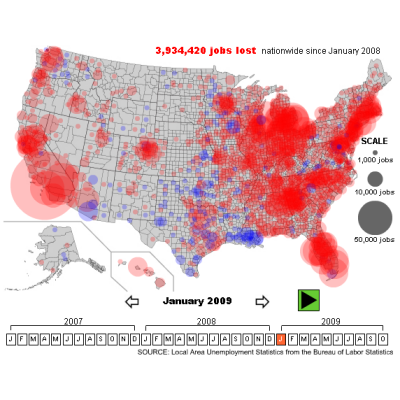
4. The Geography of Jobs - TIP Strategies
5. Realtime Downloads from the App Store - Michael Lebowitz

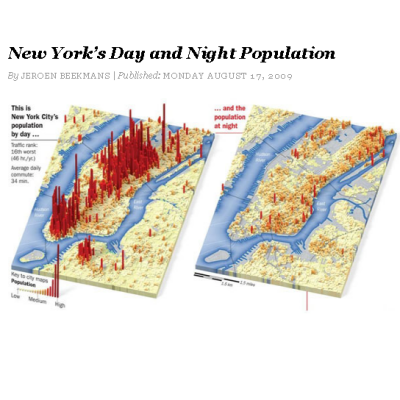
6. Manhattan's Population By Day vs Manhattan's Population By Night - Manhattan population - Gizmodo
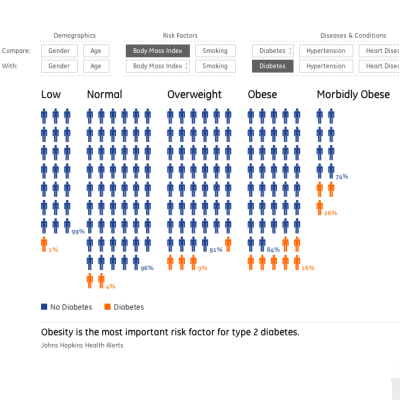
7. Take a new look at health - GE
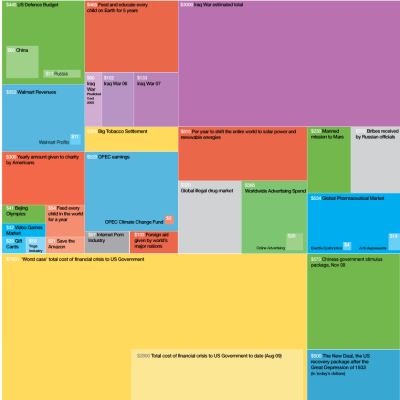
8. The Billion Dollar Gram - Information Is Beautiful
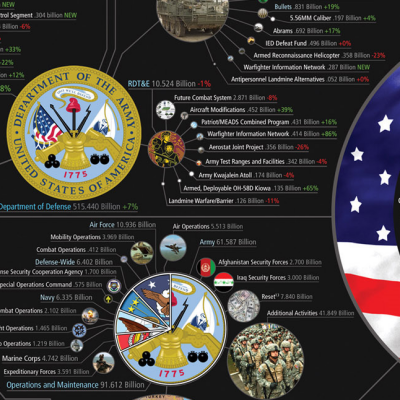
9. Death and Taxes 2009 - WallStats
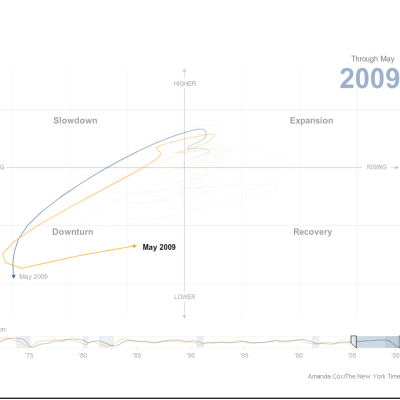
10. Turning a Corner? - NYTimes.com
Note that the link made popular on Twitter for #9 Death and Taxes was actually a link to an image on imageshack and I have used instead a link to the original source of the material.
The tweets for this entire analysis were collected from March 24, 2009 until December 31, 2009. Only the first link to a specific item from each Twitter ID was counted so that one person did not unfairly impact the results by tweeting frequently about the same thing.
Items 11-20 are listed below.
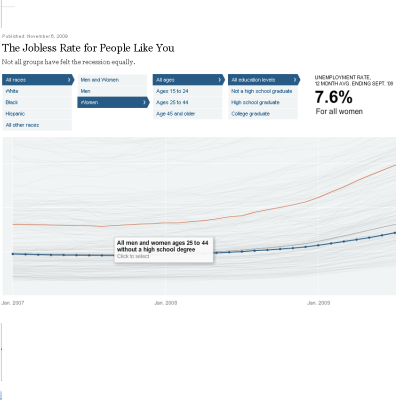
12. The Jobless Rate for People Like You - NYTimes.com
13. Cell Size and Scale

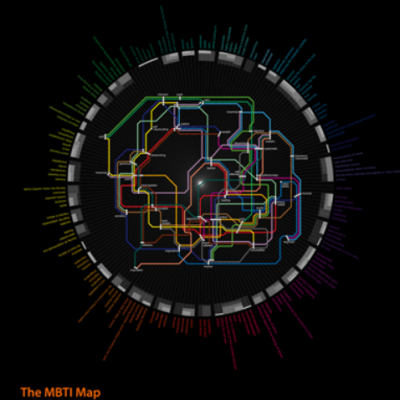
14. Subway Personality: The MBTI Map - Brain Pickings
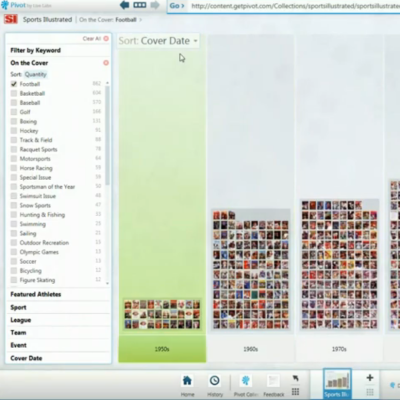
15. An In-Depth Look At Pivot, Microsoft's Newest Data Visualization Tool
16. 9/11 Pager Data Visualization - Neoformix

17. An interactive map of vanishing employment across the country - Slate Magazine
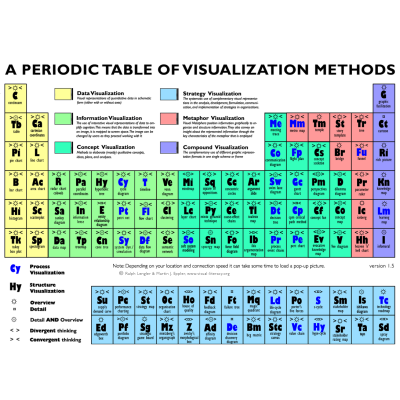
18. A Periodic Table of Visualization Methods - Visual Literacy
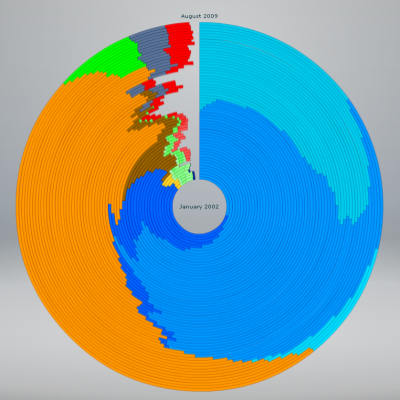
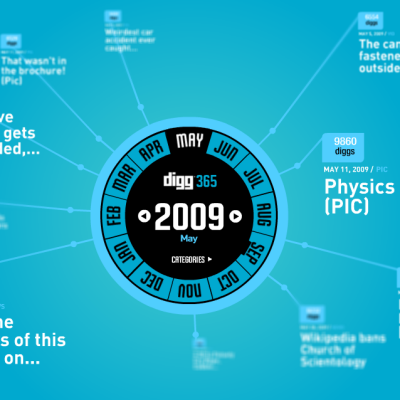
19. digg labs / 365
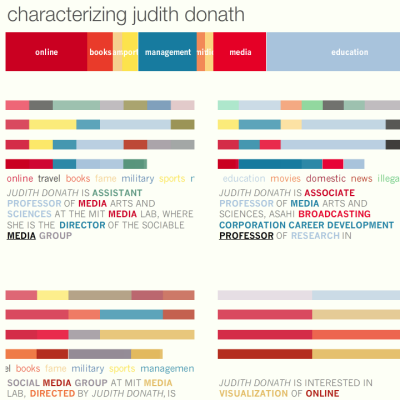
20. Personas - MIT Media Lab