An Interactive Word Graph
By: Jeff Clark Date: Sun, 04 Mar 2007
I have borrowed some aspects of the visual design of Elastic Tag Maps for a new interactive version of a word frequency graph. Here is a simple image of the results in case you have trouble running the java application. It shows a word graph for the 2007 State of the Union Address that I used as an example in Word Frequency Graphs. This time, however, I've done away with the ellipses and only draw the connections when you hover over a node.
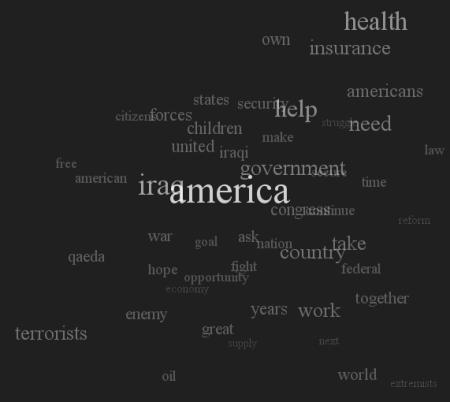
(image only - the interactive application is farther down)
The application below is in java and was created using Processing and the Traer Physics Library. Many Thanks ! This seems a bit more useful than the blue ellipse version I used before although there is more overlapping of the nodes. I've played around with source documents of varying size and it usually does a decent job of highlighting the key terms of the document. You will need to click on it before hovering on a word will do anything.