Boing Boing Analysis - Part 1
By: Jeff Clark Date: Tue, 11 Jul 2006
The weblog Boing Boing provides a convenient archive of all their posts since they started back in 2000. The collection has enough detailed information to support some interesting exploration. I'll be showing some results here over the next few weeks that look at various aspects of the posts made on Boing Boing in the period Jan 2000-Jun 2006.
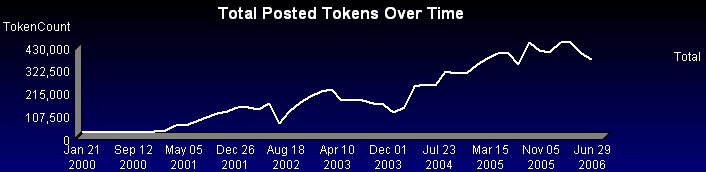
This first graph shows a simple time series of the total number of tokens published. The total time span was divided into 50 equal length periods and the total number of tokens published in each period was plotted. Binning the data into 50 periods smooths the series. It shows a rough linear trend with a few obvious dips in August 2002 and December 2003.
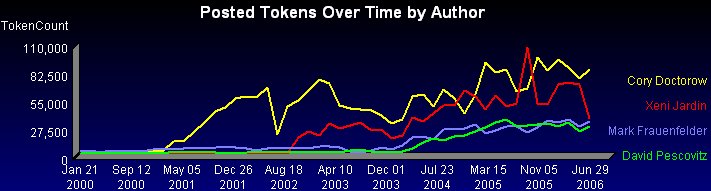
The next graph shows the same information for each individual author on Boing Boing. This clearly shows that Cory & Xeni together account for a large fraction of the text published over the last few years. Note that this 'tokencount' includes all text quoted from other sources. The dip in publishing volume for August 2002 was due entirely to a drop in Cory's production. This occurred, perhaps not coincidentally, just prior to Xeni starting to publish.
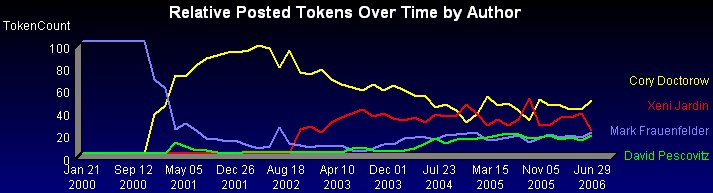
Plotting the relative fraction for each author over time highlights the fact that Mark was the only contributor initially, Cory was the dominant contributor by far in 2001-2002, and that the four author's relative contributions have remained roughly stable over 2005 and the first half of 2006.
That's all for now. Next time I will look into the distribution of posts over the different days of the week.
Related Links:
Boing Boing Analysis - Part 1 (Posts Over Time by Author)Boing Boing Analysis - Part 2 (Posts Breakdown over Day of Week)
Boing Boing Analysis - Part 3 (Images/Post over time by Author)
Boing Boing Analysis - Part 4 (Outbound Links/Post and Acronym use by Author)
Boing Boing Analysis - Part 5 (Topic Hierarchy)
Boing Boing Analysis - Part 6 (Topic Emphasis by Author)
Boing Boing Analysis - Part 7 (Images/Post for Topics and Topic Share over Time)
Boing Boing Analysis - Part 8 (Incoming Links)