Boing Boing Analysis - Part 2
By: Jeff Clark Date: Thu, 13 Jul 2006
 This continues our analysis of the posts from the Boing Boing weblog.
The question I'm interested in exploring now is what is the distribution of Boing Boing posts by day of the week ?
This continues our analysis of the posts from the Boing Boing weblog.
The question I'm interested in exploring now is what is the distribution of Boing Boing posts by day of the week ?
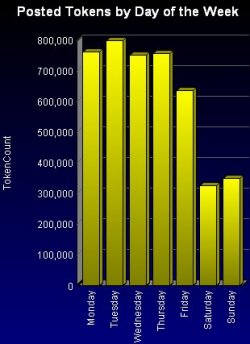
This bar graph to the right shows the number of posted tokens for each day of the week in total for the period January 2000 to June 2006. It looks quite clear that there is less published on Friday and even less on the weekend. Over this entire time period, on average, there is roughly half as much published on a weekend day compared to a day during the week.
Has this been true since inception or have there been some periods where the pattern hasn't held ?
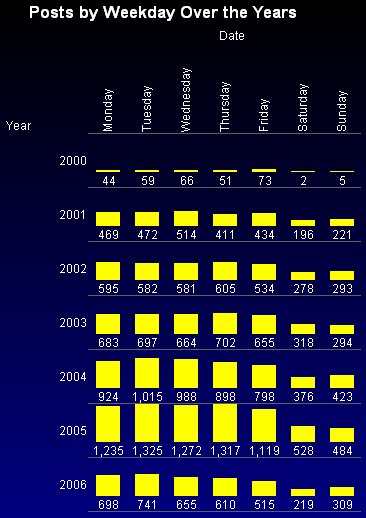 Look at this next graph. It shows the distribution of actual posts rather than the total number of tokens.
There are individual bar graphs for each year which use the same vertical scale. Looking down the day columns
it is obvious that there are many more posts in the recent years compared to 2000. Note also that the 2006
data only represents January-June , half of the year.
Look at this next graph. It shows the distribution of actual posts rather than the total number of tokens.
There are individual bar graphs for each year which use the same vertical scale. Looking down the day columns
it is obvious that there are many more posts in the recent years compared to 2000. Note also that the 2006
data only represents January-June , half of the year.
For the years 2001-2006 the number of posts on Saturday or Sunday is roughly 40% of the posts during a regular weekday. The first year of publication, 2000, is an exception here because weekend days from that year have relatively fewer posts - roughly 10% of the number on a typical weekday.
It appears that the publication of posts for Boing Boing was primarily a Monday-Friday job in the first year but has since become a 7 day per week commitment.
What about the different authors ? Do they have different weekday distributions ? Have a look at this third graph which illustrates this distribution.
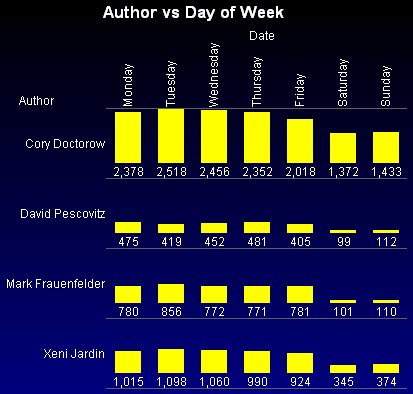 First of all, it clearly shows that Cory and Xeni post more often than Mark or David.
This was made clear also in Boing Boing Analysis Part 1.
First of all, it clearly shows that Cory and Xeni post more often than Mark or David.
This was made clear also in Boing Boing Analysis Part 1.
It's also clear that Cory publishes much more often on the weekend than the others and Mark much less often. The numbers work out like this, Percentage of posts on weekend: Cory - 19.5% , Xeni - 12.3%, David - 8.5% , and Mark - 5% .
Since Mark was the only contributor in the year 2000 this explains why there were very few weekend posts during that year.
Related Links:
Boing Boing Analysis - Part 1 (Posts Over Time by Author)Boing Boing Analysis - Part 2 (Posts Breakdown over Day of Week)
Boing Boing Analysis - Part 3 (Images/Post over time by Author)
Boing Boing Analysis - Part 4 (Outbound Links/Post and Acronym use by Author)
Boing Boing Analysis - Part 5 (Topic Hierarchy)
Boing Boing Analysis - Part 6 (Topic Emphasis by Author)
Boing Boing Analysis - Part 7 (Images/Post for Topics and Topic Share over Time)
Boing Boing Analysis - Part 8 (Incoming Links)